
DeepLTK Tutorial #3.6: Visual Anomaly Detection
- Shoghik Gevorgyan

- Oct 31, 2024
- 6 min read
Updated: Apr 3
Overview
This blog post provides an overview and implementation of Visual Anomaly Detection in LabVIEW based on DeepLTK and CuLab toolkits.
Visual Anomaly Detection (VAD) identifies deviations from normal patterns in images using computer vision and machine learning to detect defects, abnormalities, or inconsistencies. Possible applications include defect detection in manufacturing, disease diagnosis in healthcare, crop monitoring in agriculture, PCB inspection in electronics, quality control in pharmaceuticals, and more.

The advantages of this implementation are:
Unsupervised Learning – No labeled dataset needed.
Few-Shot Learning – Can be trained on images acquired only from a single good object.
Fast Training – Can be adapted to new dataset/object in under a minute.
Real-Time Inference – ~10ms (on RTX 2080 Ti GPU), 520ms (on desktop CPU).
High Accuracy – 95%+ across 80+ datasets.
Robust Performance – Can work with a basic webcam, even in non-ideal lighting.
Versatility – Tested on 80+ datasets and applicable across industries such as automotive (detecting part defects), pharmaceuticals (identifying packaging issues), textiles (spotting fabric flaws), electronics (faulty circuit detection), food production (quality control), and more.
Visual Anomaly Detection Reference Project
The project described below can be downloaded from GitHub.
Requirements
The VisualAD Project has the following dependencies:
Name | Version | Requirement | Notes |
2.0.1.18 | Required | ||
8.0.2.254 | Required | v8.0.3.258 might be required for systems without GPU (CPU Only). | |
4.1.1.77 | Optional | CuLab allows to significantly accelerate training and inference (up to 50x) with GPUs. |
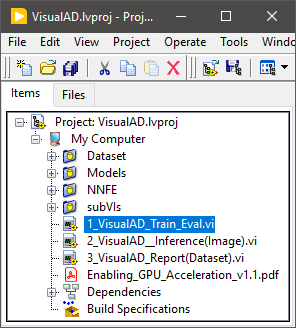
Project Content

High level description of the project’s content is provided below:
“Dataset” - Contains a small example of playing cards dataset.
"Models" - Includes pretrained anomaly detection models for playing cards dataset.
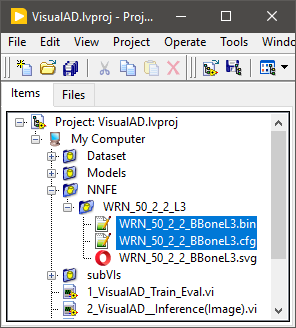
"NNFE" - Contains feature extraction model.
"subVIs" - Contains subVIs for dataset reading and anomaly detection visualization.
“1_VisualAD_Train_Eval.vi” - Is an implementation of training and evaluation processes.
“2_VisualAD_Inference(Image).vi” - Is an implementation of inference.
“3_VisualAD_Report(Dataset).vi” - Is a utility VI for generating anomaly detection results for all images in a dataset.
Dataset Preparation
The dataset reader implemented in this project requires a dataset to be structured in a specific way. In this structure the training set should consist of only normal samples, while the test/validation set should include both normal and anomalous samples. Optionally, if pixel-wise accuracy estimation is required, the ground truth masks should also be provided.
The example dataset of "Playing_Cards_3ofHearts" incorporated in the project depicts the required structure.
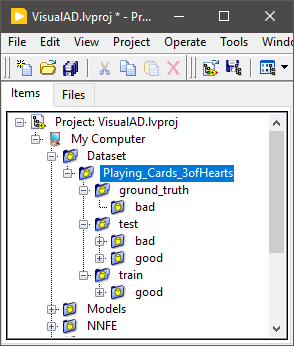
Other structures of the dataset are also applicable but it might require modifications of the dataset reader.
Training and Evaluation
The top-level implementation of the VI for training and evaluation is provided in “1_VisualAD_Train_Eval.vi”.
This VI is designed to train and evaluate model's performance with a single setup. Combining training and evaluation processes into a single VI has proven to be more efficient based on our experience of developing models for numerous datasets.
The snapshot below represents the training setup and evaluation results for the example dataset.
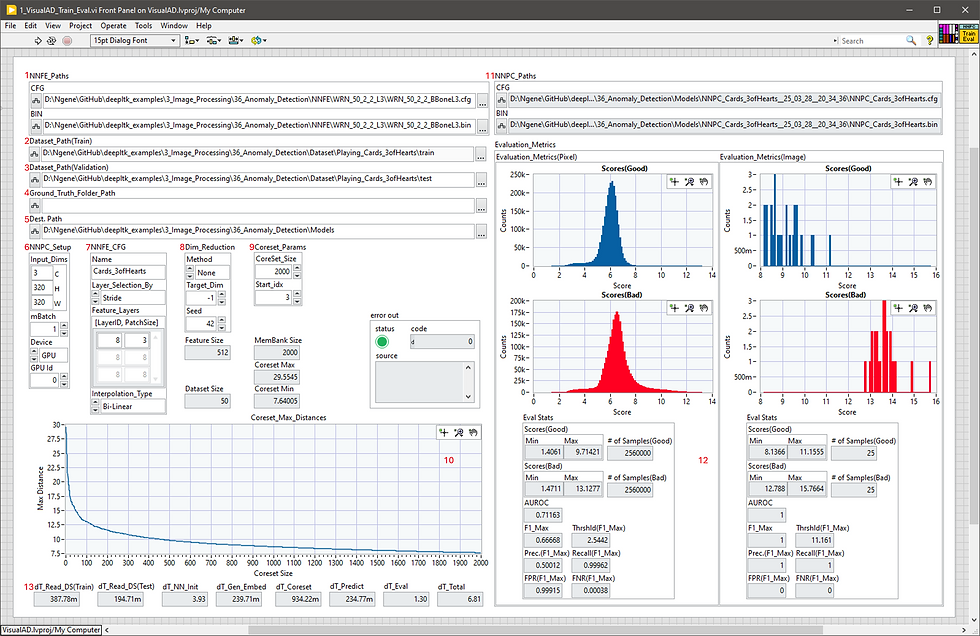
Below is a description of different components of this VI.
1 - Specifies the path to the feature extraction model (.CFG and .BIN). This model is located in the project with the following path "NNFE/WRN_50_2_L2_L3".
2 - Specifies the path to the training dataset folder.
3 - The path to the test dataset folder. The example dataset in this project is located in "Dataset\Playing_Cards_3ofHearts\ train" folder.
4 - The ground truth folder path. Since the provided dataset does not include ground truth masks, this path can be left empty.
5 - The destination folder where the trained anomaly detection model will be stored. An example of a trained model on playing cards dataset is located in the "Models" folder.
6 - Defines the input dimensions, mini-batch size and execution device (CPU or GPU).
7 - Defines the name of the model and the layers in the model to be used in the feature extraction process.
8 - Sets the dimensionality reduction parameters.
9 - Defines parameters for construction of the Memory Bank.
10 - Is the graph showing how the maximum distance between feature embeddings decreased during the construction of the Memory Bank.
11 - Contains paths to the trained model.
12 - Displays the image- and pixel-wise calculated anomaly score histograms for good and bad images, along with various performance metrics, statistics, and estimated thresholds to be used during inference.
13 - Provides detailed timing information for each stage of the process.
The hyperparameters that can influence the performance and might need to be adjusted for other datasets are: input resolution, feature extraction layers, target dimension after reduction and coreset (Memory Bank) size. In general, increasing these parameters would also increase the accuracy of the model at the cost of execution speed.
For further instructions on the described controls, please refer to the Help file of the DeepLTK Anomaly Detection Toolkit.
Inference
Once the model is trained, evaluated and the thresholds are determined, the model can be used for inference which is implemented in “2_VisualAD_Inference(Image).vi”.

This VI demonstrates the process of pretrained model loading, image reading and pre-processing, inference and visualization of the results.
The front panel of the inference VI is shown below.
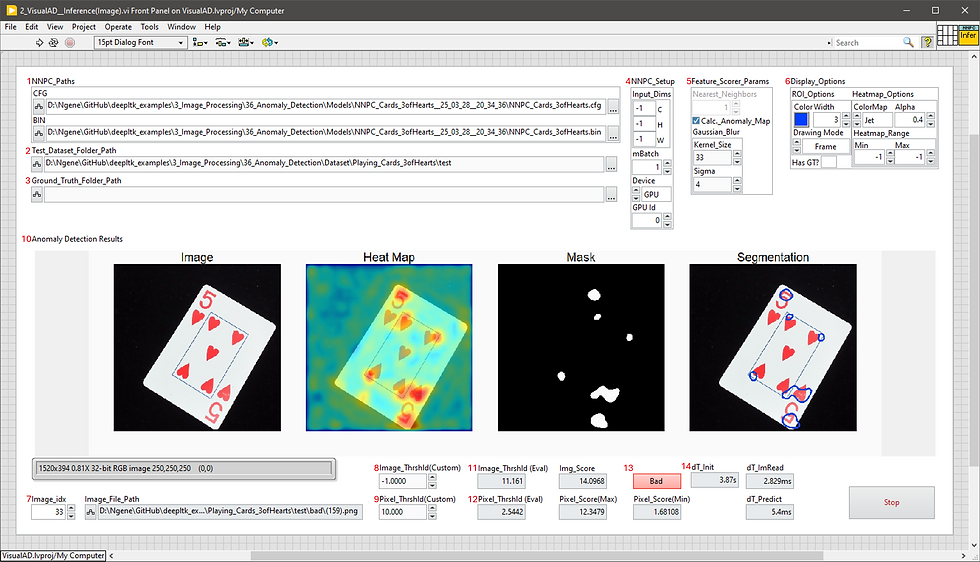
Below is a description of different components of this VI.
1 - The paths to the trained anomaly detection model.
2 - The path to the dataset folder containing test images.
3 - The ground truth folder path, if available.
4 - Defines custom input dimensions, mini-batch size and execution device. "-1" values in input dimensions mean that actual values will be taken from the pretrained model at which the model was trained.
5 - Sets the image-wise anomaly score calculation and pixel-wise heatmap post-processing parameters.
6 - Configures the visualization settings for anomaly detection results, including color schemes, colormap types, minimum and maximum ranges and other display options.
7 - Sets the index of the image in the dataset to be tested.
8, 9 - Set the custom image-wise and pixel-wise anomaly score thresholds."-1" value means that the optimal thresholds calculated during evaluation will be taken.
10 - Displays the pixel-level anomaly detection result including the original image, ground-truth (if available), anomaly score heatmap and segmentation results.
11, 12 - Represent the calculated (during evaluation) optimal mage-wise and pixel-wise anomaly score thresholds.
13 - Displays the image-wise anomaly detection result.
14 - Provides detailed timing information for each stage of the inference process.
For further instructions on the described controls, please refer to the Help file of the DeepLTK Anomaly Detection Toolkit.
Report Generation
The project also includes a utility VI, “3_VisualAD_Report(Dataset).vi”, designed to run the inference process and generate detection result for the entire dataset.

The front panel of the “3_PatchCore_Report(Dataset).vi” is shown below.
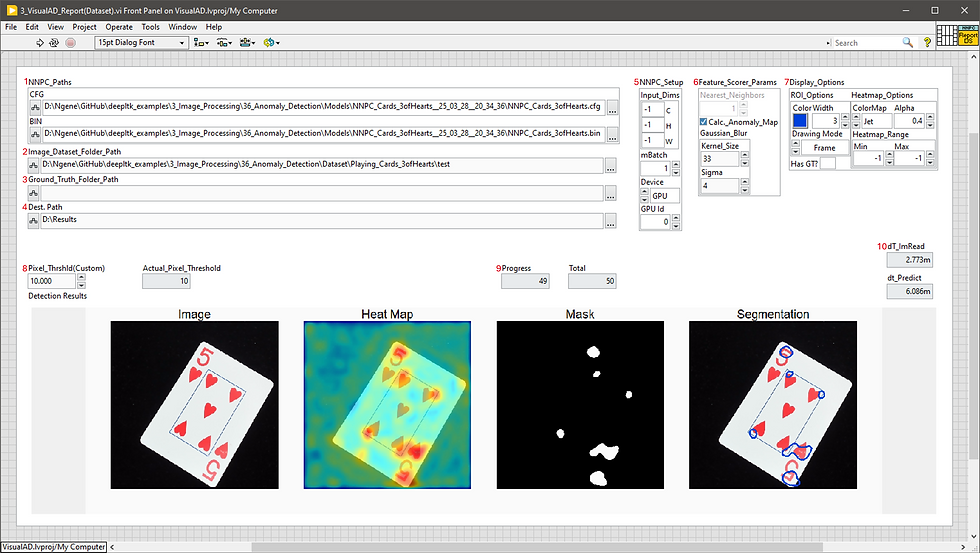
Most of the configuration parameters replicate the ones from inference VI. The only difference is the destination folder (4) where the results will be stored.
GPU Acceleration
The CuLab toolkit is required for GPU acceleration, offering up to 50x performance improvement over CPU execution during training and inference. Users who do not need GPU acceleration can skip the CuLab installation and follow the project modification instructions outlined in the provided "Enabling_GPU_Acceleration.pdf" file. On systems without NVIDIA GPUs and drivers, loading CUDA DLLs in a LabVIEW project may result in errors, which are also addressed in the same PDF.
Performance
This section represents anomaly detection performance results for different objects in MVTec AD dataset. All objects have been evaluated with the same default settings: input resolution - 224x224, coreset sub-sampling ratio - 0.1 (10%), and a projection dimension calculated using the Johnson-Lindenstrauss lemma with an epsilon of 0.9. The timing parameters are acquired for NVIDIA GeForce RTX 2080-Ti GPU.
The table below summarizes the anomaly detection results.
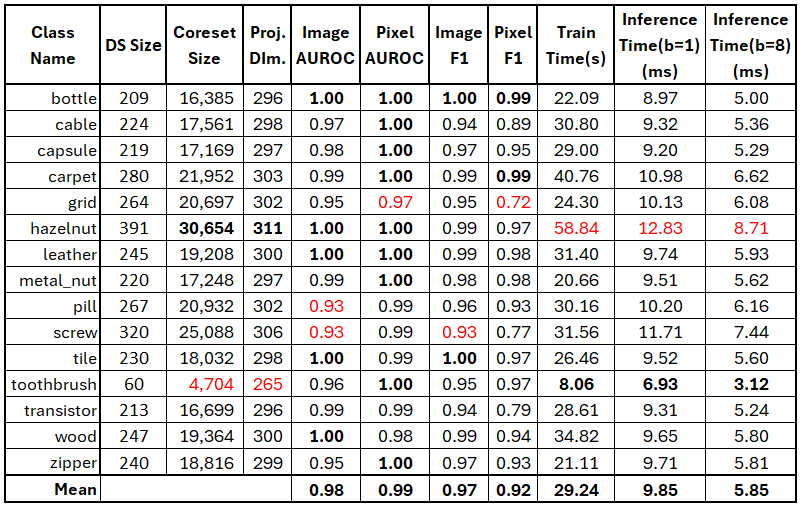
It should be noted that these numbers are acquired based on default settings and the performance can be further improved by tuning hyperparameters for each dataset.
Demo Videos
Below are a couple of videos showcasing the method's performance on custom datasets. Notably, these demonstrations were conducted under suboptimal conditions, utilizing a basic webcam and non-ideal lighting.
Conclusion
It has been shown that Visual Anomaly Detection Addon together with DeepLTK and CuLab toolkits can be effectively applied for high-accuracy, real-time anomaly detection applications across different industries.
The example project, including the dataset and pretrained models, is available for download on GitHub.
For any inquiries regarding the project or toolkits, or for assistance in integrating Visual Anomaly Detection into your application, please contact us at info@ngene.co.


Comments